Would a Larger Connection Pool Have Solved It?
Published: July 24, 2026
Point of Suspicion
Section titled “Point of Suspicion”While looking through the Minichat codebase again, the chat room creation logic caught my attention.
@Transactionalpublic ChatResponseDTO createChat(Long creatorId, ChatRequestDTO dto) { chatRepository.save(chat); // 1 record associateUsersWithChat(chat, users); // Based on number of users messageService.createSystemEntryMessage(chat, users); // 1 record publishSystemMessageToKafka(chat.getId(), systemMessage);}Creating a single room executes at least three INSERT statements, and inviting 50 people increases that to 52 INSERTs. On top of that, publishing a message to Kafka was also placed inside @Transactional.
Once a database connection is acquired to execute SQL, it isn’t returned to the pool until the transaction completes. If there’s a slow operation inside, the connection stays held for that entire duration. I thought the connection pool might run dry under heavy traffic, and I wanted to test if that was actually true.
First Hypothesis
Section titled “First Hypothesis”Producing to Kafka inside a transaction increases connection hold time. Longer connection hold times cause Pending Threads to appear under lower loads.
This was the hypothesis I came up with after reading the code. To see if it was actually true in practice, I set up a test environment first.
Test Environment
Section titled “Test Environment”| Item | Value |
|---|---|
| Server instances | 3 (local1 / local2 / local3) |
| Connection pool | HikariCP, maximumPoolSize=20, minimumIdle=20 |
| DataSource | Master-Replica routing + LazyConnectionDataSourceProxy |
| Load testing tool | k6, constant-vus for 30s |
| Monitoring | Prometheus + Grafana |
I added three HikariCP panels to Grafana.
| Panel | Query |
|---|---|
| Active Connections | hikaricp_connections_active |
| Pending Threads | hikaricp_connections_pending |
| Usage Time | hikaricp_connections_usage_seconds_max |
hikaricp_connections_pending — The number of threads waiting because they couldn’t get a connection. If this goes above 0, it means the pool is already running short.
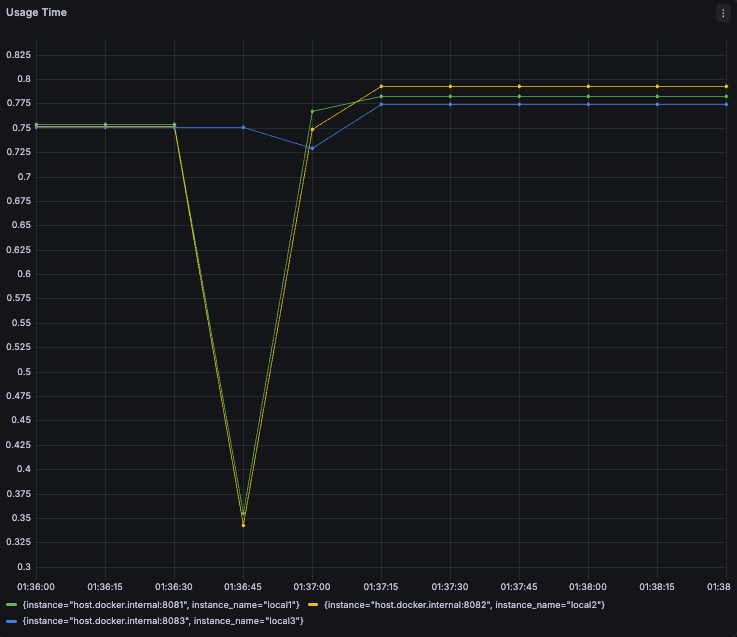
usage_seconds_max — A metric that slowly decays after capturing the highest peak over a period. It shows the “worst single case,” not the average.
I dropped Prometheus’s scrape_interval from the default 15 seconds down to 1 second. A transaction finishes in a few hundred milliseconds, so if you scrape metrics every 15 seconds, you miss everything happening in between. When Pending reads as 0, you can’t tell if there was really no waiting or if it just missed the scan timing. Setting a short interval resolved that uncertainty.
global: scrape_interval: 1s evaluation_interval: 5sWhy the First Test Failed
Section titled “Why the First Test Failed”I generated load using an existing message pipeline test scenario. In this test, 60 users send 1,200 TALK messages over 30 seconds.
| Metric | Value |
|---|---|
| Heap usage | 1.9% |
| CPU usage | 0.179 |
| Active Connections | 0 |
| Pending Threads | 0 |
It looked like almost no load reached the server. Looking into why, two issues were overlapping.
The code did not wait for the Kafka produce result. kafkaTemplate.send() returns a CompletableFuture right away. Since the code didn’t wait for the result with .get(), the transaction finished without waiting for Kafka’s response. There was no reason for the connection to stay held. So the first hypothesis was wrong.
Note that send() isn’t always non-blocking. If the producer’s internal buffer fills up, it actually blocks for the configured timeout duration. Under this test load, though, it never got to that point.
I was measuring the wrong thing. The transaction for sending a single TALK message executes only 1 INSERT. The heavy operation, createChat, ran sequentially only 15 times inside the test script’s setup() step and stopped there. It was omitted entirely from the actual load scenario body.
What I intended to measure wasn’t even in the benchmark.
Resetting the Target of Measurement
Section titled “Resetting the Target of Measurement”This time, I wrote a new script moving createChat inside the main body of the load test scenario. In this setup, each VU repeatedly creates chat rooms for 30 seconds.
I separated two variables into environment variables:
| Variable | Target of Control |
|---|---|
MEMBERS | Number of INSERTs per transaction |
VUS | Number of concurrent requests |
k6 run -e MEMBERS=20 -e VUS=30 connection-pool-test.jsk6 run -e MEMBERS=50 -e VUS=100 connection-pool-test.jsI separated these two variables to test my next hypothesis.
Second Hypothesis
Section titled “Second Hypothesis”If the transaction is heavy, the connection hold time gets longer. Therefore, Pending Threads will show up at a lower number of concurrent requests.
I expected that bumping MEMBERS from 20 to 50 would trigger pool exhaustion earlier, even at the same VU count.
Baseline Across 6 Combinations
Section titled “Baseline Across 6 Combinations”I combined 2 MEMBERS settings and 3 VUS settings into 6 total conditions and ran each for 30 seconds.
MEMBERS=20 (22 INSERTs per transaction)
Section titled “MEMBERS=20 (22 INSERTs per transaction)”| VUs | Concurrent Requests per Server | Active | Pending | Throughput | p95 | Median |
|---|---|---|---|---|---|---|
| 30 | 10 | 10 | 0 | 140.98/s | 158ms | 85ms |
| 60 | 20 | 20 | 0 | 217.43/s | 253ms | 137ms |
| 100 | 33 | 20 | 11 | 234.64/s | 422ms | 275ms |
MEMBERS=50 (52 INSERTs per transaction)
Section titled “MEMBERS=50 (52 INSERTs per transaction)”| VUs | Concurrent Requests per Server | Active | Pending | Throughput | p95 | Median |
|---|---|---|---|---|---|---|
| 30 | 10 | 10 | 0 | 68.26/s | 356ms | 239ms |
| 60 | 20 | 20 | 0 | 97.36/s | 569ms | 389ms |
| 100 | 33 | 20 | 14 | 103.57/s | 892ms | 672ms |
Not a single request failed across all 6 runs.
Because VUs were split across 3 server instances, concurrent requests per server equaled VUs ÷ 3. Active Connections moved right along with that number until capping out at the maximum pool size of 20.
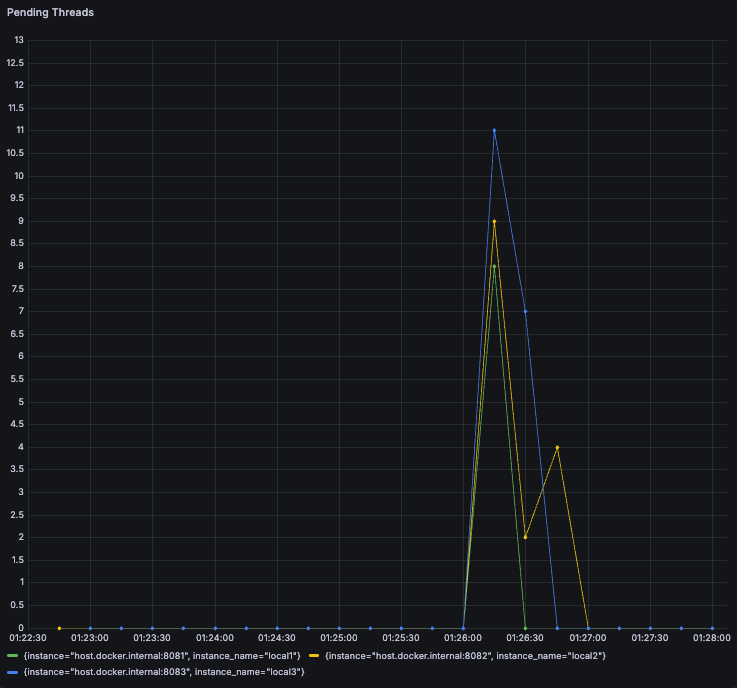
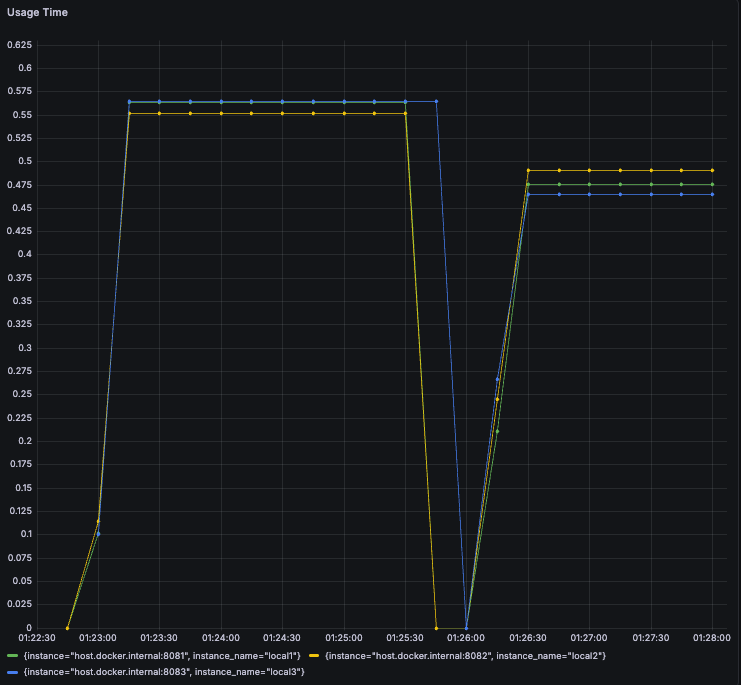
What Triggers Pending Threads?
Section titled “What Triggers Pending Threads?”The second hypothesis was wrong too.
| Condition | Requests per Server | INSERTs per Transaction | Pending |
|---|---|---|---|
| MEMBERS=20, VU60 | 20 | 22 | 0 |
| MEMBERS=50, VU60 | 20 | 52 | 0 |
| MEMBERS=20, VU100 | 33 | 22 | 11 |
| MEMBERS=50, VU100 | 33 | 52 | 14 |
Even when I multiplied the INSERTs inside the transaction by 2.4x, Pending stayed at 0 for VU60. Pending threads only started showing up on both sides when I raised VUs from 60 to 100.
Each incoming request holds exactly one connection whether it takes a short time or a long time. If a server receives 20 concurrent requests and has a pool of 20, everyone gets one and nobody waits. In the end, Pending is a metric that shows up specifically when Concurrent Requests > Pool Size.
However, the load generation strategy plays a role here. In k6, constant-vus sends the next request only after getting a response for the previous one, so maximum concurrent requests stay capped at the VU count. If transactions slow down, the interval between requests just widens, but concurrent requests don’t increase.
Real production services are different. Request arrival rates come in regardless of response times, so when transactions slow down, processing requests pile up and concurrent requests go up. In that situation, a heavy transaction can eventually lead to Pending connections.
So Why Did It Slow Down Then?
Section titled “So Why Did It Slow Down Then?”Comparing conditions where Pending was 0 gives us the answer:
| Condition | Pending | Throughput | p95 | Usage Time |
|---|---|---|---|---|
| MEMBERS=20, VU60 | 0 | 217.43/s | 253ms | 0.25s |
| MEMBERS=50, VU60 | 0 | 97.36/s | 569ms | 0.8s |
Even with connections remaining in the pool, throughput dropped by nearly half while latency more than doubled.
In the end, these two metrics were looking at different things:
- Pending Threads — Did concurrent requests exceed the pool size?
- Usage Time / Throughput — How long is a connection held inside the transaction?
Distinguishing between these two matters because what you need to fix changes. If I had judged performance strictly by Pending threads, I might have said “Let’s just bump the pool size to 40.” But in the MEMBERS=50, VU60 run, p95 latency was already 569ms despite room left in the pool. Increasing pool size in this state changes nothing.
The Cost of Repeated save() Calls
Section titled “The Cost of Repeated save() Calls”Looking strictly at transaction count, MEMBERS=50 ran half as many transactions, but total INSERT counts showed this side was giving the DB more work.
| Condition | Transaction Count | Total INSERTs | INSERTs per Second |
|---|---|---|---|
| MEMBERS=20, VU100 | 7,802 | 171,644 | ~5,720/s |
| MEMBERS=50, VU100 | 3,916 | 203,632 | ~6,790/s |
Execution was stuck right around 6,000–7,000 INSERTs per second. Looking into why it capped out there, the issue was in the code connecting users to the chat room:
private void associateUsersWithChat(Chat chat, List<User> users) { for (User user : users) { UserChat userChat = new UserChat(); userChat.setId(userChatIdGenerator.generate()); userChat.setUser(user); userChat.setChat(chat); userChatRepository.save(userChat); // Repeated for each user }}Creating a 50-user room calls save() 50 times. Without explicit batch settings, Hibernate flushes 50 individual INSERT statements one by one, stacking up network round trips to the DB. The active transaction holds onto its connection without letting go until all 50 finish.
This was the main reason Usage Time reached 0.8 seconds.
Switching to Batch Processing
Section titled “Switching to Batch Processing”I changed two places in the code.
private void associateUsersWithChat(Chat chat, List<User> users) {    List<UserChat> userChats = users.stream()            .map(user -> {                UserChat userChat = new UserChat();                userChat.setId(userChatIdGenerator.generate());                userChat.setUser(user);                userChat.setChat(chat);                return userChat;            })            .toList();
userChatRepository.saveAll(userChats);}spring: jpa: properties: hibernate: jdbc: batch_size: 50 order_inserts: trueOne thing to watch out for: if you only change to saveAll() without setting batch_size, INSERTs still go out one by one under the hood. You have to apply both to get them bundled into real batch inserts.
Before and After Improvement
Section titled “Before and After Improvement”I re-tested under the highest load condition (MEMBERS=50, VUS=100).
| Metric | Before Improvement | After Improvement | Change |
|---|---|---|---|
| Throughput | 103.57/s | 175.06/s | +69% |
| Created Rooms | 3,916 | 6,699 | +71% |
| p95 | 892ms | 555ms | -38% |
| Median | 672ms | 325ms | -52% |
| Average | 672ms | 350ms | -48% |
| INSERTs per Second | ~6,790 | ~11,610 | +71% |
While p95 improved, what caught my eye was that median latency dropped even more. This means normal requests got faster overall, not just a few outlier cases.
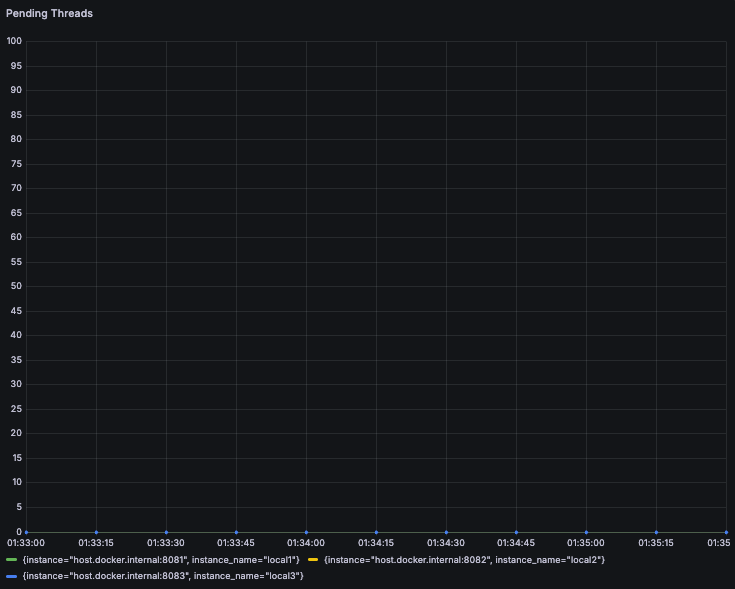
Before Improvement
Section titled “Before Improvement”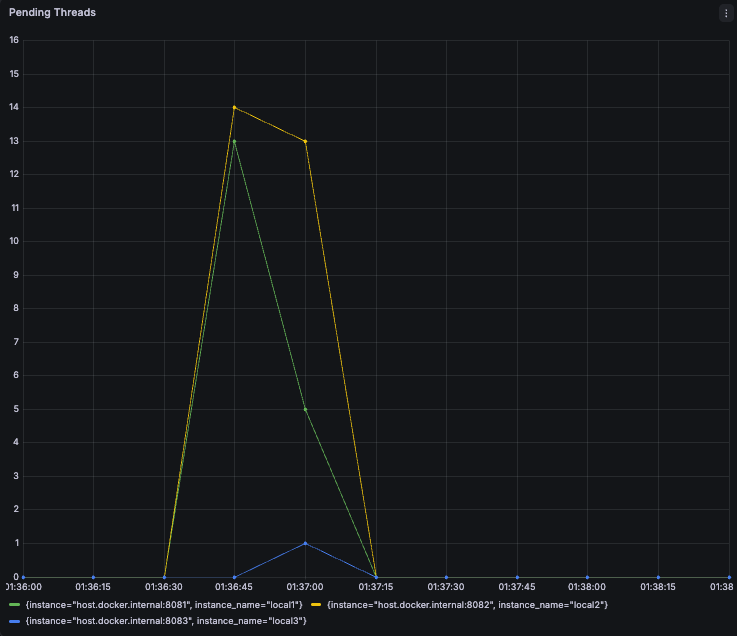
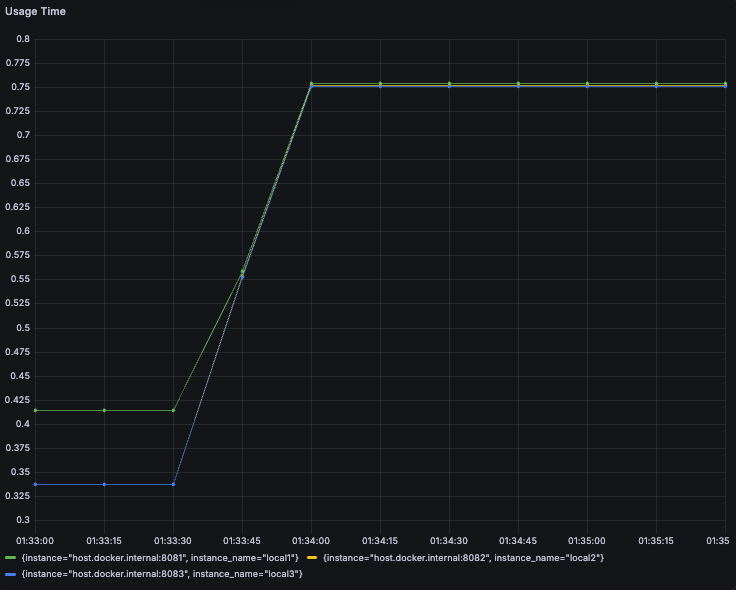
After Improvement
Section titled “After Improvement”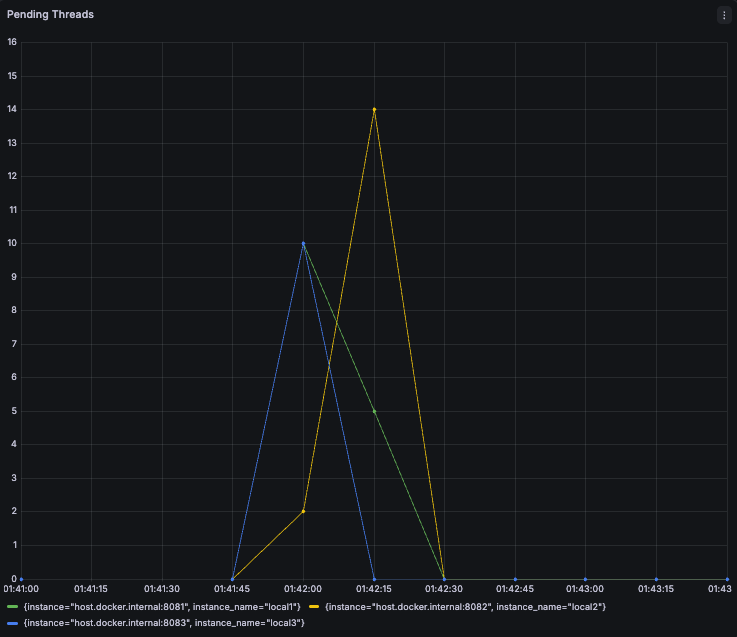
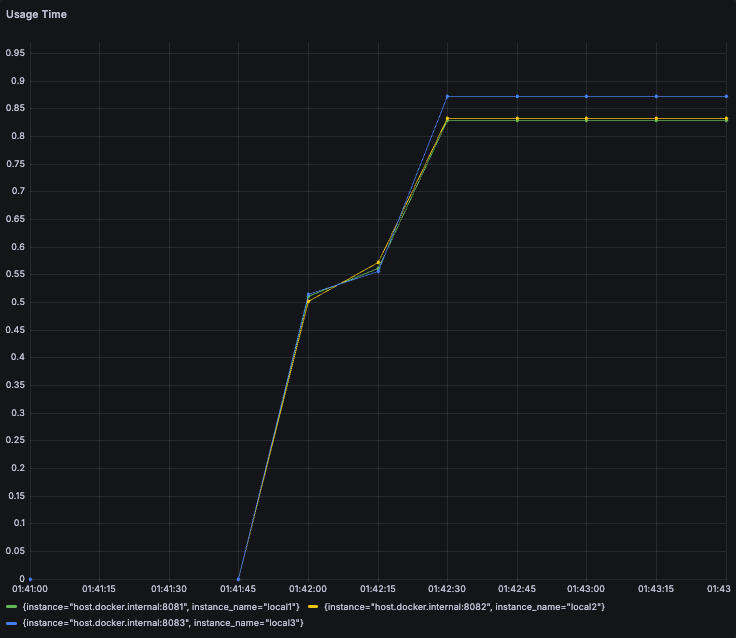
Looking at the graphs alone, peak values for Pending and Usage Time don’t look like they dropped much after the fix. That’s because these panels show “the worst single value at that moment.” What actually changed was the total request volume processed during the same 30 seconds and the reduced median latency.
Two Axes of Analysis
Section titled “Two Axes of Analysis”Both hypotheses I set in this experiment were wrong.
The first assumed external I/O inside a transaction would hold the connection longer. But because Kafka produce calls didn’t wait for the result, the connection wasn’t really held. That wasn’t something I could know just by looking at the code.
The second assumed doing more work inside a transaction would cause pool exhaustion sooner. But in this test scope, Pending responded to concurrent request counts rather than transaction weight.
To summarize:
- Pending Threads are driven by the relationship between concurrent requests and pool size.
- Usage Time and Throughput show how long the work inside the transaction actually takes.
- These two metrics track different things, and you can’t judge one just by looking at the other.
Reducing DB round trips was the priority, not increasing the pool size. If I hadn’t actually run the test and measured it, I would have looked at code structure alone and fixed the wrong place.