Was Single gRPC Relay Really That Slow?
Published: July 25, 2026
Background
Section titled “Background”Minichat runs across multiple server instances. Redis tracks which instance each user is connected to. When a message targets a user connected elsewhere, it has to be relayed over gRPC.
The initial implementation sent one gRPC call per remote recipient.
[Single relay]
Server A → Server B [user1 (1 gRPC call)]Server A → Server B [user2 (1 gRPC call)]Server A → Server B [user3 (1 gRPC call)]
If there are 100 remote users, that’s 100 gRPC calls. Instead, I changed it so that each destination server receives a single bulk request.
[Bulk relay]
Server A → Server B: [user1, user2, user3, ...] (1 gRPC call)
I re-measured the difference between the two approaches across a range of load conditions.
Why I discarded the previous measurement
Section titled “Why I discarded the previous measurement”This wasn’t the first time I ran this experiment. I had run an A/B test before, and the results looked like this.
| Bulk | Single | |
|---|---|---|
| Delivery rate | 100.0% | 21.9% |
| p95 latency | 346ms | 1m 49s |
| Throughput | 18,634/s | 4,081/s |
A delivery rate of 21.9% doesn’t mean performance dropped — it means most messages were never delivered at all. Because most messages were never delivered, the 1m 49s p95 only reflects the small fraction of messages that actually arrived. It can’t be taken as the actual performance of the single relay.
Since the measurement itself was no longer reliable, comparing the two approaches made little sense. I discarded the previous result and redesigned the experiment.
Redesigning the experiment
Section titled “Redesigning the experiment”Two variables
Section titled “Two variables”Adjusting only the number of users in a room changes two things at once.
- The number of recipients per message
- The number of messages generated per second in the room
When both variables move together, you can’t isolate the cause when the result gets worse. This time I split them into separate variables: the number of people in the room, and the number of people actually sending messages.
With this setup I can, for example, create a condition where a room has 150 people but only 30 of them send messages while the rest only receive.
What to measure
Section titled “What to measure”Counting only the number of gRPC calls gives a partial picture. To understand how much work the server is actually doing, you have to look at the unit of work (Task) submitted to the thread pool.
Here, a Task means one Runnable submitted to the thread pool.
When a message comes in, the server does the following.
Single relay
150 Tasks total
1 message arrives    ├── Local delivery (50 Tasks)   : WebSocket → users 1–50, each sent individually    └── Remote delivery (100 Tasks) : gRPC      → Server B (user 51)                                        : gRPC      → Server B (user 52)                                        : ...                                        : gRPC      → Server C (user 150)
Bulk relay
52 Tasks total
1 message arrives    ├── Local delivery (50 Tasks)   : WebSocket → users 1–50, each sent individually    └── Remote delivery (2 Tasks)   : gRPC      → Server B [list of users 51–100]                                        : gRPC      → Server C [list of users 101–150]
For a room of 150 people across 3 servers, the number of Tasks per message is 150 for single relay and 52 for bulk relay (50 local WebSocket + 2 remote gRPC). All of these Tasks are processed by the same thread pool. Bulk relay reduces not just the number of gRPC calls but the number of Tasks submitted to the thread pool.
So in this experiment I observed the thread pool size (executor_pool_size_threads) alongside the number of Tasks, not just latency.
Controlled variables
Section titled “Controlled variables”The following values were fixed while comparing the two approaches.
| Item | Value |
|---|---|
| Server instances | 3 |
| Thread pool | core 30 / max 200 / queue 1000 |
| Load duration | 120s send + 60s receive drain |
| Prometheus scrape | 1s |
The two modes were switched by a config flag on the same build. I avoided running separately built binaries.
Re-measurement results
Section titled “Re-measurement results”Across all 10 conditions, delivery rate was 100% and Kafka LAG was 0. The count sent by k6, the Kafka offset increase, and the number of rows stored in the DB all matched.
Axis A — increasing the number of people in the room
Section titled “Axis A — increasing the number of people in the room”| Room size | p50 | p95 | max | Tasks/s | Thread pool size | |
|---|---|---|---|---|---|---|
| 30 | Single | 64ms | 107ms | 340ms | 890/s | 30 |
| Bulk | 60ms | 105ms | 422ms | 360/s | 30 | |
| 90 | Single | 42ms | 81ms | 476ms | 2,600/s | 200 |
| Bulk | 73ms | 111ms | 410ms | 950/s | 30 | |
| 150 | Single | 118ms | 167ms | 275ms | 4,400/s | 200 |
| Bulk | 45ms | 80ms | 202ms | 1,550/s | 30 |
The “Tasks/s” column is rate(...[10s]) applied to the executor_completed_tasks_total counter.
Axis B — room fixed at 150 people, increasing the number of senders
Section titled “Axis B — room fixed at 150 people, increasing the number of senders”| Messages/s | p50 | p95 | max | Tasks/s | Thread pool size | |
|---|---|---|---|---|---|---|
| 10 | Single | 36ms | 71ms | 219ms | 1,500/s | 170 |
| Bulk | 41ms | 62ms | 208ms | 500/s | 30 | |
| 30 | Single | 118ms | 167ms | 275ms | 4,400/s | 200 |
| Bulk | 45ms | 80ms | 202ms | 1,550/s | 30 | |
| 50 | Single | 181ms | 298ms | 662ms | 7,300/s | 200 |
| Bulk | 99ms | 154ms | 205ms | 2,300/s | 30 |
Three things stood out in the tables.
- Under low load, the difference between the two approaches was small.
- At 90 people in the room, single relay measured a lower p50.
- Under the highest load, bulk relay’s latency stayed more stable.
I looked at these three in order.
Analysis
Section titled “Analysis”Load size and the latency gap
Section titled “Load size and the latency gap”At 30 people in the room and 30 messages/s, the two approaches had p50 values of 64ms and 60ms — nearly the same. At 150 people and 50 messages/s, they diverge to 181ms and 99ms.
The difference between the two approaches isn’t only in the number of gRPC calls. Single relay creates one Task per recipient, while bulk relay creates one Task per server. As a result, the amount of work entering the thread pool differs even under the same load.
To find the cause, I looked To check whether this difference actually shows up in thread pool behavior, I looked at how ThreadPoolTaskExecutor behaves.
1. If threads < 30 → create a thread2. If the queue has room → put it in the queue (up to 1000)3. If the queue is full → create a thread (up to 200)4. If that overflows too → the caller runs it directly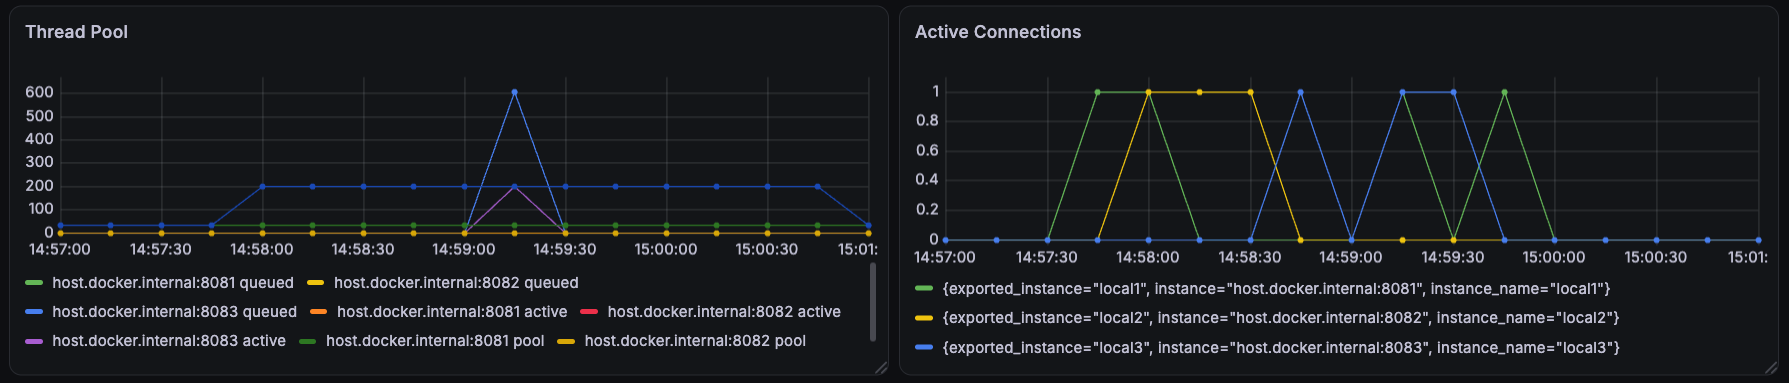
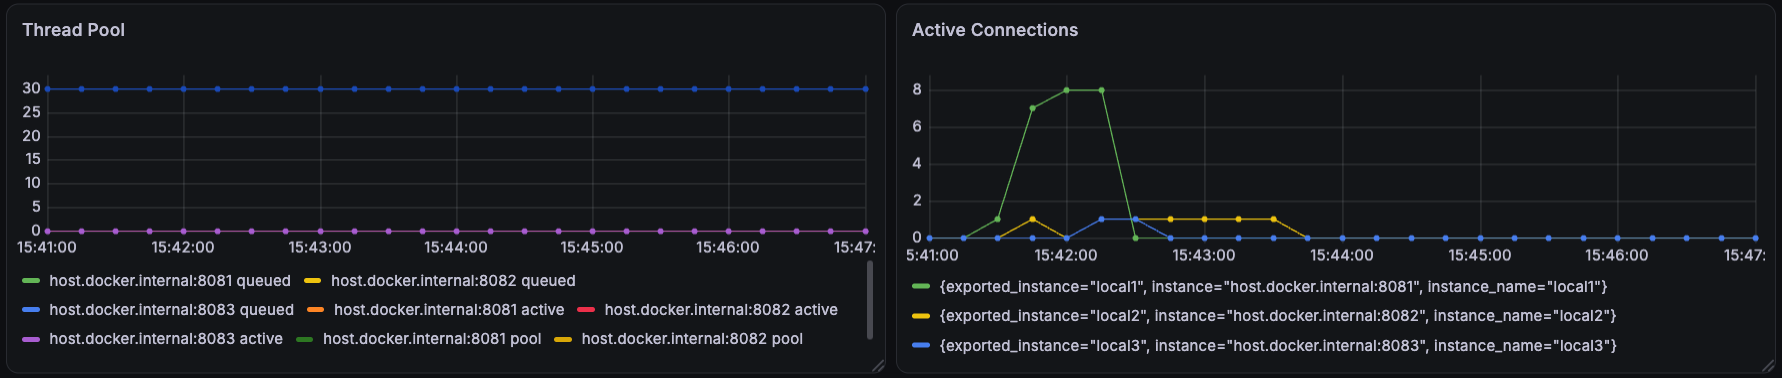
Room of 150 people, 50 messages/s. Single relay on top, bulk relay on the bottom. The Y-axis range is fixed to be identical across both graphs.
Single relay expanded to 200 threads without exception at 90 people or more in the room. Bulk relay stayed at 30 across all 10 conditions.
Reaching 200 threads does not imply failure. Under the same condition, delivery rate was 100% and Kafka LAG was 0. Single relay handled the load by using resources up to the maximum.
Both approaches handled the load. The difference is the amount of resources used to do it.
[Single]
Tasks 4,400/s──► ThreadPool expands──► Thread [200 / 200]──► handled
Single relay expanded to 200 threads without exception at 90 people or more in the room. Bulk relay stayed at 30 across all 10 conditions.
Single relay also processed every message correctly. Delivery rate was 100% and no Kafka LAG occurred.
But to do so, it had to expand the thread pool to its maximum size of 200.
[Bulk]
Tasks 1,550/s──► no expansion──► Thread [ 30 / 200]──► handled
With its current settings (core 30, queue 1000), ThreadPoolTaskExecutor only creates additional threads once the queue is full.
Bulk relay created few Tasks to begin with, and the thread pool stayed at its core size (30) throughout the measurement. The fact that threads stayed at 30 means that under this load, work never piled up enough to fill the queue.
Why single relay was faster at 90 people
Section titled “Why single relay was faster at 90 people”At 90 people in the room, single relay’s p50 was 42ms and bulk relay’s was 73ms — single was lower.
Single relay created many Tasks, and the thread pool expanded to its maximum size of 200. With the current thread pool settings, additional threads are only created after the queue is full, so this means the queue reached saturation under this load.
Bulk relay created few Tasks to begin with, so it didn’t need to add threads. It handled the load with just 30 threads, but since the number of parallel operations was lower than single relay, its p50 came out somewhat higher under this condition.
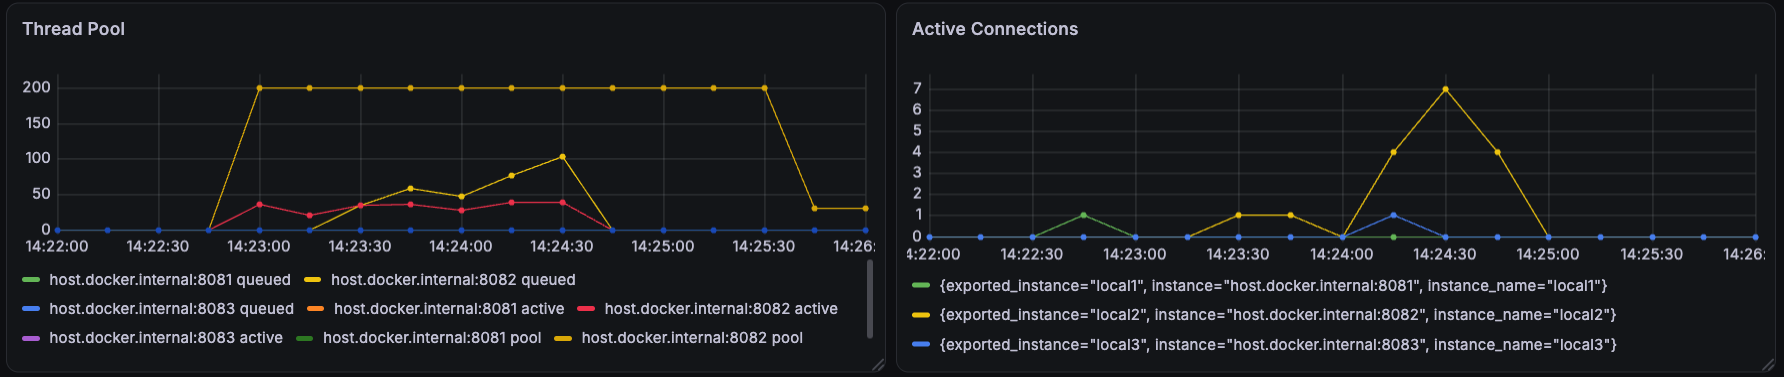
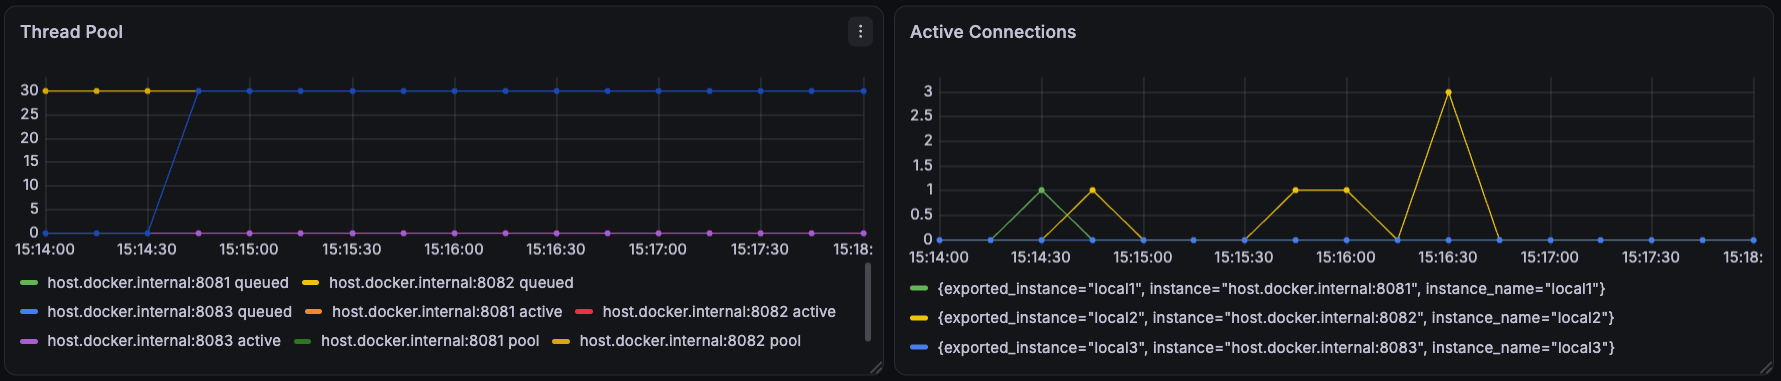
Room of 90 people. On top, single relay expanded to 200 threads; on the bottom, bulk relay stayed at 30.
At 150 people in the room, threads had already reached the maximum (200), so parallelism couldn’t be increased further. Tasks added beyond that point couldn’t be processed in parallel right away, and as a result p50 rose as well.
The single relay p50 at 30 people (64ms) being higher than at 90 people (42ms) has the same cause. The 30-person case is handled with 30 threads, while the 90-person case expanded threads and allowed more parallel processing.
Tail latency
Section titled “Tail latency”My hypothesis before measuring was as follows. Bulk relay processes recipients in order within a single gRPC call, so the last user on that server waits for all preceding sends to finish. This sequential processing could make max latency worse.
However, the result contradicted the hypothesis.
| Condition | Single max | Bulk max |
|---|---|---|
| 150 people · 30 msg/s | 275ms | 202ms |
| 150 people · 50 msg/s | 662ms | 205ms |
150 people at 50 messages/s is the condition where bulk relay’s sequential wait is longest. Even so, bulk relay’s max was lower than single relay’s.
Bulk relay processes 50 recipients sequentially within a single Task, but the number of Tasks itself is very small. Single relay, on the other hand, registers thousands of Tasks per second into the thread pool, and Task registration, scheduling, and context switching keep happening.
Under this load, that overhead outweighed the cost of sequential processing, and as a result bulk relay’s max latency was lower.
Factors that distorted the measurement
Section titled “Factors that distorted the measurement”In a performance experiment, once a factor other than the performance you’re measuring gets mixed into the result, the numbers lose meaning. I had to eliminate the following sources of measurement noise.
| Factor | Effect on the result |
|---|---|
| Log level set to DEBUG | Same condition, p50 66ms → 36ms |
| Micrometer histogram error | Metric collection failed under higher load |
| Reset script changed the Kafka partition count | Control across conditions broke |
When DEBUG-level logs are written thousands of lines per second, that itself becomes load. After measuring the first condition, I changed the log level to WARN and re-measured, and p50 dropped from 66ms to 36ms.
Micrometer’s histogram calculation threw an exception once load passed a certain level, and as a result /actuator/prometheus returned 500. This experiment didn’t need histogram metrics, so I disabled that setting.
The reset script deleted the Kafka topic, which caused the partition count to be recreated at the default (1). If the partition count differs per condition, you can’t compare the same load, so I changed it to keep the topic and reset only the DB.
After removing these factors, I re-measured every condition.
Why I didn’t use the queue-depth peak as a comparison metric
Section titled “Why I didn’t use the queue-depth peak as a comparison metric”The executor_queued_tasks (queued task count) value needed care when interpreting. For example, in single relay the peak under the 150-person condition was 179, but a lower-load condition showed 398.
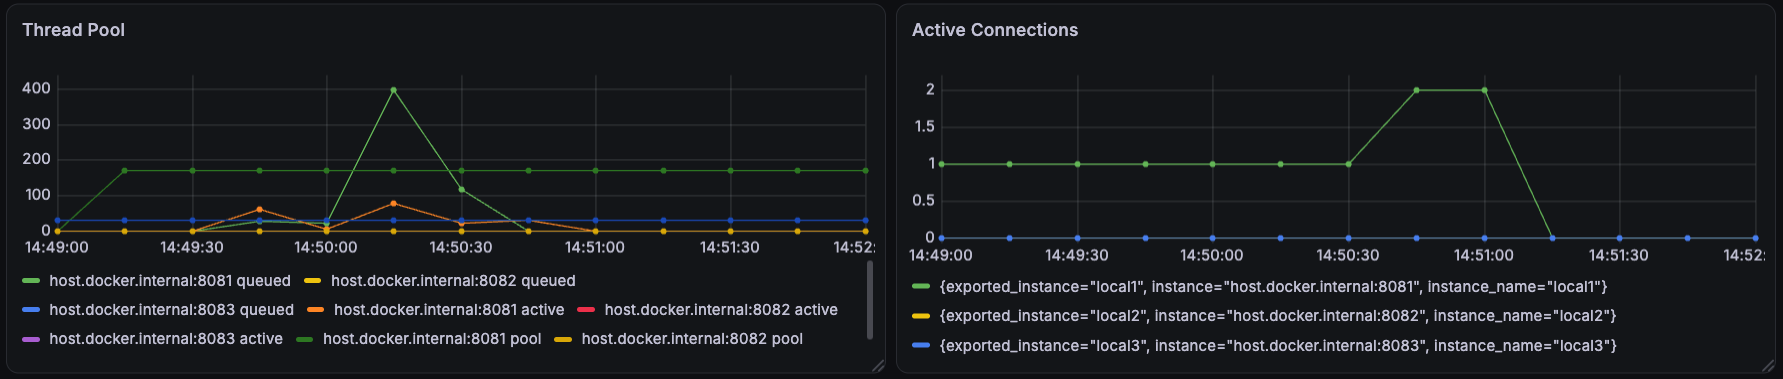
The 398 was observed right after the test started. It stays near 0 for the rest of the run.
At first glance, it looks like the queue piled up more under lower load. But the cause wasn’t message-processing load — it was the window right after the test started, where 150 WebSocket connections were created at once.
During the stretch where actual message load was sustained, the queue size stayed near 0 most of the time. So I judged this value to reflect a momentary burst of connections rather than the system’s processing limit.
In this experiment, I didn’t use the queue-depth peak as a criterion for judging saturation. Instead, I compared whether the thread pool actually expanded as load increased.
Closing
Section titled “Closing”There were two conclusions from this experiment.
First, bulk relay was faster not because it reduced gRPC calls, but because it greatly reduced the number of Tasks (work) thrown at the thread pool. Because of that, it could handle the same load without expanding the thread pool.
Second, the part that took the longest in this experiment wasn’t measuring performance, but making sure I could measure it reliably. I confirmed once again that a single log setting or metric configuration can change the result.